The Essential E-commerce Metrics Every Store Owner Should Track
A practical guide to the numbers that reveal how your online store is performing—and where your next growth opportunity may be hiding.
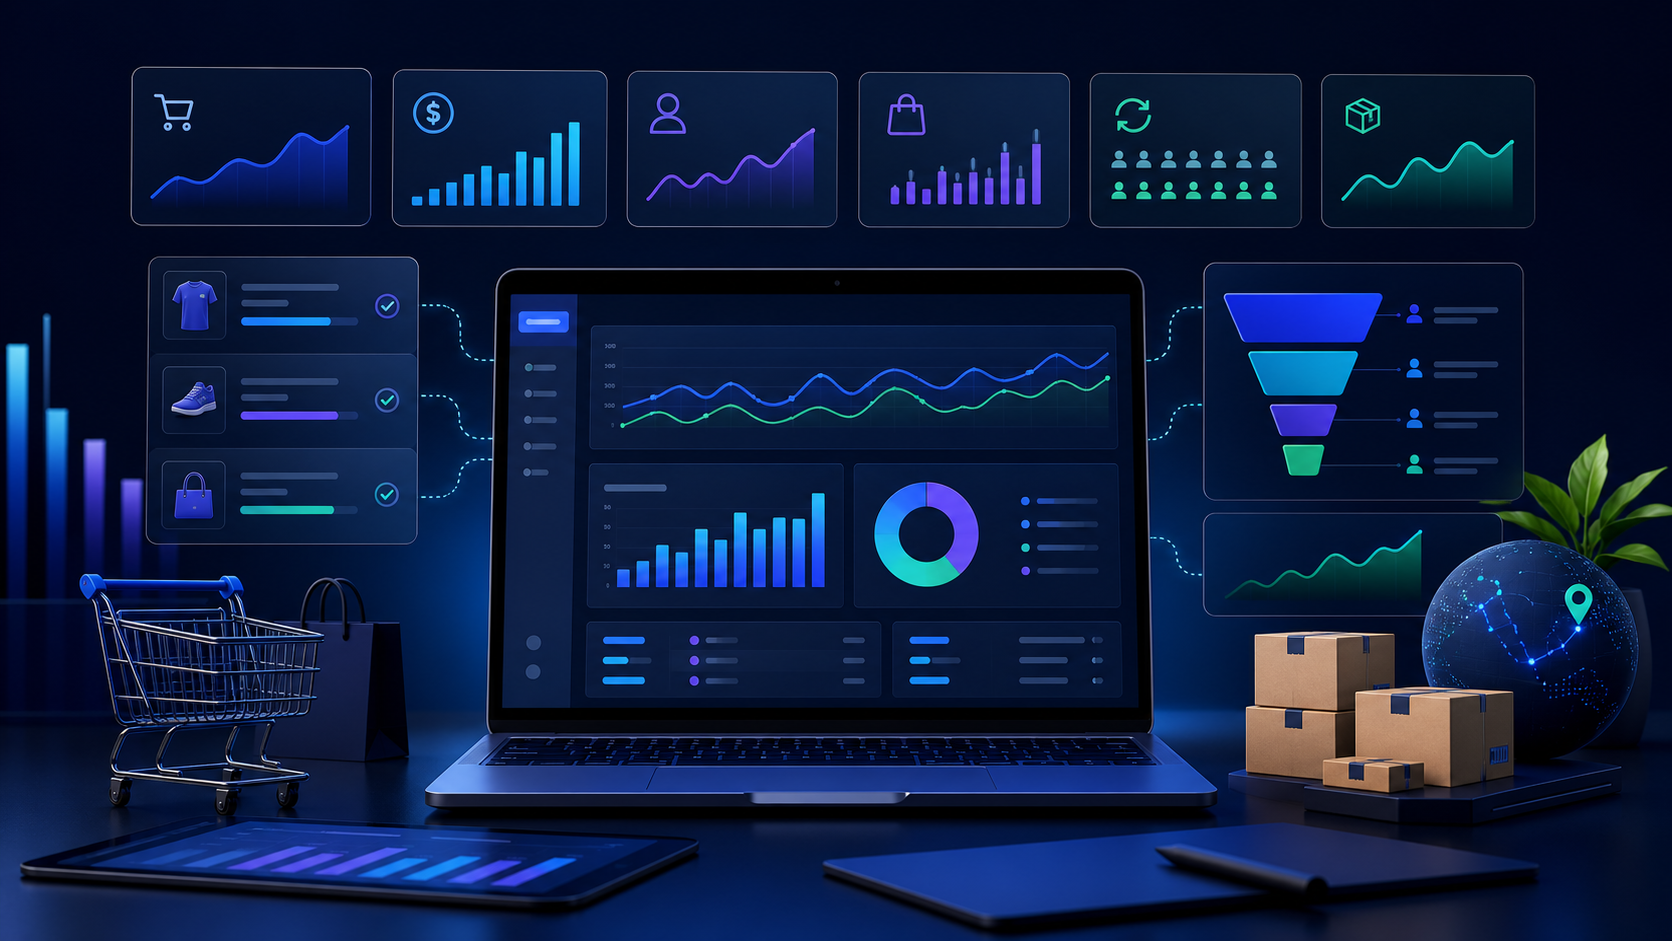
Running an online store without reliable metrics is like travelling without a map. Orders may be arriving and revenue may be increasing, but those numbers alone do not explain whether the business is becoming healthier, more efficient or more profitable.
The right e-commerce metrics help store owners understand what is working, identify problems early and make decisions with greater confidence. The goal is not to monitor every number available. It is to focus on a small group of indicators that connect directly to customer behaviour and business performance.
Total Orders
Total order count is one of the simplest indicators of store activity. Tracking it over time helps reveal whether demand is growing, remaining stable or declining.
The number becomes more useful when compared across consistent periods. A store owner might compare this week with the previous week or examine the last 30 days against the 30 days before that. Sudden changes should be investigated alongside promotions, product availability, seasonal demand and marketing activity.
Revenue Trend
Revenue shows the total value generated by completed sales, but a single total offers limited insight. A trend line provides more context by showing how revenue changes over days, weeks or months.
Store owners should look for patterns rather than reacting to one unusually strong or weak day. A steady upward trend may indicate sustainable progress, while frequent drops could point to inconsistent traffic, stock problems or changes in customer demand.
Average Order Value
Average order value, often called AOV, measures how much customers spend in a typical order. It is calculated by dividing total revenue by the number of orders during the same period.
Increasing AOV can help a business grow without acquiring more customers. Product bundles, relevant add-ons, free-delivery thresholds and thoughtful recommendations can encourage customers to add more value to each purchase. The objective should always be to improve the customer's experience rather than apply unnecessary pressure.
Order Status Distribution
The number of delivered orders is important, but so are pending, cancelled and returned orders. Looking at the complete status distribution reveals what happens after customers place their orders.
A large number of pending orders may suggest a processing delay. A rising cancellation rate could indicate unclear product information, confirmation problems or delivery concerns. Monitoring the mix allows the team to identify operational issues before they affect a larger number of customers.
Conversion Rate
Conversion rate measures the percentage of store visitors who complete a desired action, usually placing an order. Strong traffic with very few orders often means the customer journey needs attention.
Possible causes include slow pages, confusing navigation, limited product information, unexpected costs or a checkout process that feels difficult. Conversion should be reviewed together with traffic quality because not every visitor arrives with the same level of purchase intent.
Repeat Customer Rate
New customers create growth, while returning customers often create stability. Repeat customer rate shows how many buyers come back to purchase again.
A healthy repeat rate can indicate that products meet expectations and the overall experience builds trust. Store owners can support repeat purchases through dependable service, useful follow-up communication, relevant offers and a consistent brand experience.
Fulfilment Time
Fulfilment time measures how long it takes an order to move from placement to dispatch or delivery. Customers may accept different delivery windows, but they expect the process to be predictable.
Tracking fulfilment time helps businesses find delays in confirmation, packing, courier handover or internal coordination. Faster is valuable, but consistency and clear communication are equally important.
Cancellation and Return Rate
Cancellations and returns are not just lost orders. They are signals that can reveal gaps in product descriptions, quality expectations, address confirmation, payment handling or delivery service.
The rate should be reviewed by product, location, payment method and reason whenever that information is available. Patterns are more valuable than isolated cases. A recurring reason provides a practical starting point for improvement.
Use Metrics Together, Not in Isolation
No single metric explains the complete condition of an online store. Revenue may rise while cancellations also increase. Order volume may grow while average order value falls. Faster fulfilment may improve repeat purchases over time.
The most useful insights come from connecting related numbers and understanding the story behind them. A commerce analytics dashboard should make these relationships easier to see without overwhelming the user.
Turn Insight into Action
Metrics only create value when they lead to better decisions. Store owners should review a focused dashboard regularly, select one important issue or opportunity and define a clear action for the next period.
Jeepno brings order activity, revenue trends and status information into a clearer analytics experience so growing businesses can understand performance without becoming data experts. When reliable information becomes part of the daily workflow, decisions become faster, priorities become clearer and growth becomes easier to manage.